| Fractal Concept |
| Programming Tips |
ˇ@
Fractal
Concept
( Reference: Fractal Programming
in C )
What are Fractals ?
Mandelbrotˇ¦s classical definition:
"A fractal is a curve whose Hausdorff-Besicovitch dimension is larger than its Euclidian dimension."
Recursive techniques and iterated expressions were found that could describe curves that have fractional dimensions.
ˇ@
What
are Fractals good for ?
Ignoring the artistic value, "Fractals appear to provide solutions to many previously unanswered questions at the frontiers of the physical sciences."
ˇ@
How are Fractals Used
Fractal curves are the natural way of representing objects and as a means of representing natural scenes. Moreover, fractals occur naturally in the expressions for mathematical phenomena as varied as the prediction of weather systems, the describing of turbulent flow of liquid, and the growth and decline of population. Fractals are also useful in dimensional transformations that can used for expressing and compressing graphical data.
ˇ@
ˇ@
Basic Considerations
Investigation of the chaotic field of fractal:
ˇ@
Fractal
Dimension
Suppose that we start with an initiator that is some simple geometric figure consisting of a number of connected line segments. It may be a triangle or a square or even straight a straight line. We now define a generator. This generator is a series of line segments that is going to replace every line segment of the initiator. The generator consists of N line segments, each of length r, where re is a fraction of the line segment being replaced. The arrangement of the N line segments is such that the distance from the beginning of the generator to its end is the same as the length of the line segment being replaced. The replacement process repeats an infinite number of times, each time replacing each line segment of the previous level curve with a scaled-down replica of the generatro. It can then be shown that the Hausdorff-Besicovithc dimension of the resulting fractal curve is
ˇ@
![]()
Comparing this demension with the Euclidian dimension gives us some idea of the properties of fractal . For example, a D of 1.0 is imply an ordinary line, whereas a D of 2.0 means that the curve completely fills the plane.
ˇ@
Algorithm for calculate power
Very often, the calculation of a to power is necessary in mathematics program. However, not all programming language support the power or it provides only integer parameter. If the programming language support natural log and anti-log e, you may try this
ˇ@
![]()
ln y = b ln a
![]()
ˇ@
Now, you may write you own power
function which support non-integer no. Here is an example:
|
Function power(a, b As Variant) power = Exp(b * Log(a)) End Function
|
ˇ@
Draw a line
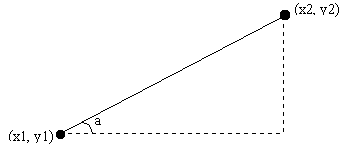
To draw a line, it requires two end points of a line. The length, point and angle of line are changing for every iteration. For a line information
A point (x1,y1)
Angle (a)
Length ( r )
Then another point (x2,y2) can be calculated by the following formular
![]() ,
,![]()
ˇ@
ˇ@
=> ![]() ,
, ![]()
Cos (a) = (x2-x1)/r -> x2=x1 +r cos (a)
Sin (a) = (y2-y1)/r -> y2=y1 +r sin (a)
ˇ@
It should not be difficult,
right ?
ˇ@
Recursive concept
To plot a fractal graph, a "replaced segment" is imposed on every segment. A recursive method is somehow better than a "for loop" for infinite iterations and structure.
Here is a simple program for factorial
function(Basic):
|
Function fractorial(n As Integer) If n = 1 Then fractorial = 1 Else fractorial = n * fractorial(n - 1) End If |
Then
ˇ@
1! = 1
2!= 2*1!
3!=3 *2!
4! =4*3!
ˇ@
ˇKˇK
So, the concept can be applied to
the fractal making on replacing segment.
ˇ@